Overview
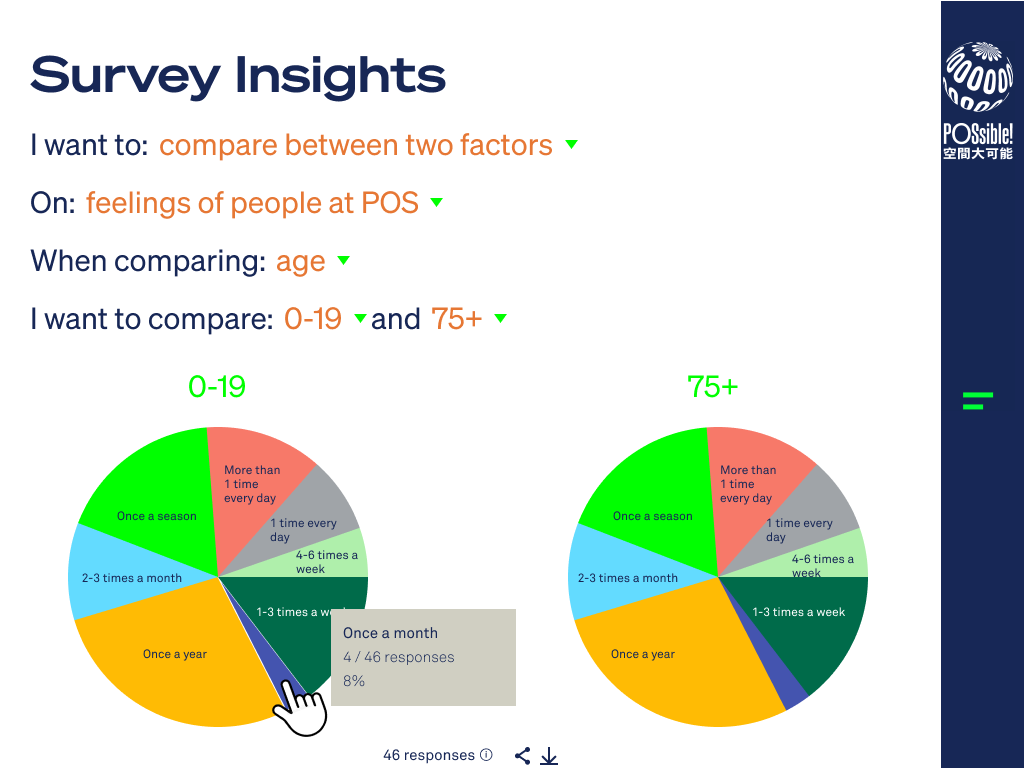
- Allowed local residents to query neighborhood facility and utilization data through a friendly, conversational interface
- Visualized complex data using NI Lab’s style guide and D3 visualization library.
Challenges & Solutions
- The neighborhood facility and utilization data, collected before the start of this project, was unorganized and unclean. It took some effort to map the survey results to appropriate standardized D3 visualization types that not only accurately represented the data but also inspired residents to explore and make use the of the data to better utilize neighborhood facilities as well as to provide useful feedback for local district councils.